


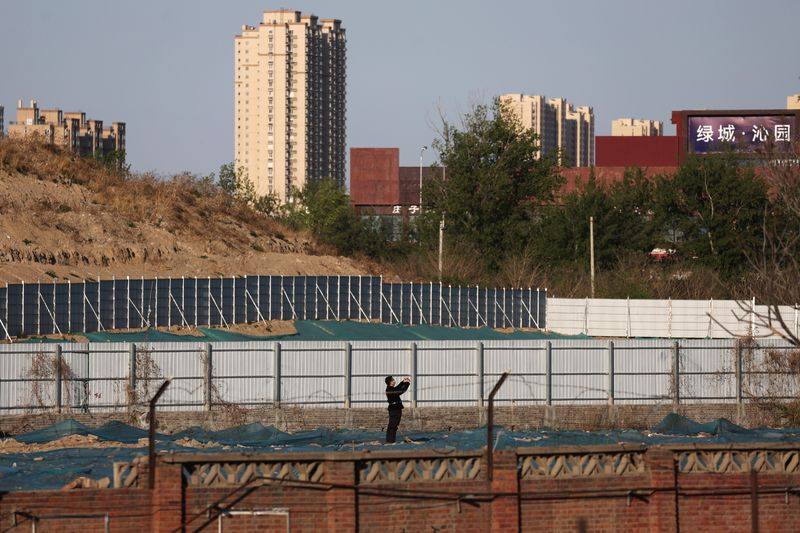
 © Reuters. A man walks at a construction site near residential buildings in Beijing, China April 14, 2022. Picture taken April 14, 2022. REUTERS/Tingshu Wang
 By Liangping Gao and Ryan Woo
BEIJING (Reuters) -Woes in China's property market worsened in August, with official data showing home prices, sales and investment all falling in August, as a mortgage boycott and developers' financial strains further hurt confidence in the sector.
New home prices resumed their month-on-month decline in August, down 0.3%, Reuters calculations based on National Bureau of Statistics (NBS) data showed, dragged down by weak demand in smaller cities amid persistently slow deliveries by heavily-indebted developers. Prices were unchanged in June and July.
More significantly, prices extended their year-on-year contraction for the fourth month in August, with prices last month falling 1.3%, the fastest annual pace in seven years, and suggesting longer-term homebuyer aversion.
The deepening property woes are weighing on the outlook for the world's second-largest economy, which narrowly escaped a contraction in the second quarter. The sector, once a key driver of economic growth, has lurched from crisis to crisis since 2020 after regulators stepped in to cut excess debt at developers.
"The sector is still in the process of finding its bottom, though it is getting closer, even as policies have been eased across the board," said Zhang Dawei, chief analyst at property agency Centaline.
Authorities have taken steps to prop up the sector this year, including relaxations on home purchases, smaller downpayments, cuts in mortgage interest rates, and a bigger reduction in the selling price of homes.
Zhang said he expected Chinese authorities to roll out more measures in tier-one cities such as Beijing and Shanghai and tier-two cities to stabilise the market and restore buyers' confidence in the near term.
Confidence in the sector has been dampened by a mortgage boycott across the country since late June as developers stopped building presold housing projects due to strapped liquidity and strict COVID restrictions.
Separate data from the statistics bureau on Friday showed property sales declining for a 13th consecutive month in August, not helping to shore up sentiment.
Property sales by floor area dropped 22.58% year-on-year, according to Reuters calculations based on the NBS data, the sixth month in a row it suffered double-digit falls. Sales tumbled 23.0% year-on-year in the January-August period.
After the data releases, the CSI Real Estate Index on mainland stock markets fell 1.73%. The Hang Seng Mainland Properties Index in Hong Kong declined 0.73%.
UNFINISHED PROJECTS
Month-on-month price falls spread to more cities in August, with unfinished projects across China increasingly a longer-term drag on sentiment.
Out of the 70 cities surveyed by NBS, 50 reported price falls in August, up from 40 cities in July.
Home prices dropped 0.2% and 0.4% in tier-two and tier-three cities respectively, official data showed.
"It will take some time for the pool of unfinished property construction projects to be completed with local government support for developers, and in turn, for Chinese households to consider investing in property in scale again," said Robert Carnell, regional head of research at ING.
"Consequently, these numbers are likely to remain a blot on the economic landscape for quite a while."
Property investment and new construction starts by developers also fell in August, suggesting many real estate companies were still focusing on paying back debt instead of launching new projects.
Investment dropped 13.8% year-on-year in August after slumping 12.3% in July. It shed 7.4% in the January-August period.
New construction starts measured by floor area plunged 45.7% year-on-year -- its biggest fall in almost a decade -- after a 45.4% slump in July.
The fall of the Chinese yuan, also known as the renminbi, below 7 per dollar on Friday would only add to developers' woes.
Chinese property firms are the country's biggest issuers of dollar bonds, and the yuan's depreciation would only make it costlier for them to refinance their debt.


EUR/USD
1.0658
-0.0008 (-0.07%)
Summary
↑ SellMoving Avg:
Buy (0)
Sell (12)
Indicators:
Buy (2)
Sell (3)
EUR/USD
1.0658
-0.0008 (-0.07%)
Summary
↑ SellMoving Avg:
Buy (0)
Sell (12)
Indicators:
Buy (2)
Sell (3)
GBP/USD
1.2475
-0.0015 (-0.12%)
Summary
↑ SellMoving Avg:
Buy (0)
Sell (12)
Indicators:
Buy (0)
Sell (10)
USD/JPY
157.91
+0.12 (+0.07%)
Summary
↑ BuyMoving Avg:
Buy (12)
Sell (0)
Indicators:
Buy (9)
Sell (0)
AUD/USD
0.6469
-0.0003 (-0.05%)
Summary
NeutralMoving Avg:
Buy (10)
Sell (2)
Indicators:
Buy (2)
Sell (3)
USD/CAD
1.3780
+0.0003 (+0.03%)
Summary
↑ BuyMoving Avg:
Buy (12)
Sell (0)
Indicators:
Buy (7)
Sell (0)
EUR/JPY
168.32
+0.10 (+0.06%)
Summary
↑ BuyMoving Avg:
Buy (12)
Sell (0)
Indicators:
Buy (9)
Sell (0)
EUR/CHF
0.9808
+0.0001 (+0.01%)
Summary
NeutralMoving Avg:
Buy (0)
Sell (12)
Indicators:
Buy (3)
Sell (2)
Gold Futures
2,295.80
-7.10 (-0.31%)
Summary
↑ SellMoving Avg:
Buy (0)
Sell (12)
Indicators:
Buy (0)
Sell (9)
Silver Futures
26.677
+0.023 (+0.09%)
Summary
↑ SellMoving Avg:
Buy (2)
Sell (10)
Indicators:
Buy (0)
Sell (9)
Copper Futures
4.5305
-0.0105 (-0.23%)
Summary
↑ BuyMoving Avg:
Buy (10)
Sell (2)
Indicators:
Buy (8)
Sell (1)
Crude Oil WTI Futures
81.14
-0.79 (-0.96%)
Summary
↑ SellMoving Avg:
Buy (0)
Sell (12)
Indicators:
Buy (1)
Sell (7)
Brent Oil Futures
85.62
-0.71 (-0.82%)
Summary
↑ SellMoving Avg:
Buy (1)
Sell (11)
Indicators:
Buy (1)
Sell (7)
Natural Gas Futures
1.946
-0.009 (-0.46%)
Summary
↑ SellMoving Avg:
Buy (0)
Sell (12)
Indicators:
Buy (0)
Sell (5)
US Coffee C Futures
213.73
-13.77 (-6.05%)
Summary
↑ SellMoving Avg:
Buy (3)
Sell (9)
Indicators:
Buy (0)
Sell (10)
Euro Stoxx 50
4,920.55
-60.54 (-1.22%)
Summary
↑ SellMoving Avg:
Buy (4)
Sell (8)
Indicators:
Buy (1)
Sell (7)
S&P 500
5,035.69
-80.48 (-1.57%)
Summary
↑ SellMoving Avg:
Buy (0)
Sell (12)
Indicators:
Buy (0)
Sell (7)
DAX
17,921.95
-196.37 (-1.08%)
Summary
↑ SellMoving Avg:
Buy (0)
Sell (12)
Indicators:
Buy (1)
Sell (6)
FTSE 100
8,144.13
-2.90 (-0.04%)
Summary
SellMoving Avg:
Buy (5)
Sell (7)
Indicators:
Buy (2)
Sell (4)
Hang Seng
17,763.03
+16.12 (+0.09%)
Summary
↑ SellMoving Avg:
Buy (0)
Sell (12)
Indicators:
Buy (1)
Sell (6)
US Small Cap 2000
1,973.05
-42.98 (-2.13%)
Summary
↑ SellMoving Avg:
Buy (0)
Sell (12)
Indicators:
Buy (0)
Sell (7)
IBEX 35
10,854.40
-246.40 (-2.22%)
Summary
NeutralMoving Avg:
Buy (6)
Sell (6)
Indicators:
Buy (3)
Sell (3)
BASF SE NA O.N.
49.155
+0.100 (+0.20%)
Summary
↑ SellMoving Avg:
Buy (0)
Sell (12)
Indicators:
Buy (1)
Sell (7)
Bayer AG NA
27.35
-0.24 (-0.87%)
Summary
↑ SellMoving Avg:
Buy (0)
Sell (12)
Indicators:
Buy (0)
Sell (8)
Allianz SE VNA O.N.
266.60
+0.30 (+0.11%)
Summary
↑ SellMoving Avg:
Buy (0)
Sell (12)
Indicators:
Buy (3)
Sell (5)
Adidas AG
226.40
-5.90 (-2.54%)
Summary
↑ SellMoving Avg:
Buy (0)
Sell (12)
Indicators:
Buy (2)
Sell (7)
Deutsche Lufthansa AG
6.714
-0.028 (-0.42%)
Summary
NeutralMoving Avg:
Buy (3)
Sell (9)
Indicators:
Buy (9)
Sell (1)
Siemens AG Class N
175.90
-1.74 (-0.98%)
Summary
↑ SellMoving Avg:
Buy (0)
Sell (12)
Indicators:
Buy (0)
Sell (9)
Deutsche Bank AG
15.010
-0.094 (-0.62%)
Summary
NeutralMoving Avg:
Buy (4)
Sell (8)
Indicators:
Buy (6)
Sell (2)
| EUR/USD | 1.0658 | ↑ Sell | |||
| GBP/USD | 1.2475 | ↑ Sell | |||
| USD/JPY | 157.91 | ↑ Buy | |||
| AUD/USD | 0.6469 | Neutral | |||
| USD/CAD | 1.3780 | ↑ Buy | |||
| EUR/JPY | 168.32 | ↑ Buy | |||
| EUR/CHF | 0.9808 | Neutral |
| Gold | 2,295.80 | ↑ Sell | |||
| Silver | 26.677 | ↑ Sell | |||
| Copper | 4.5305 | ↑ Buy | |||
| Crude Oil WTI | 81.14 | ↑ Sell | |||
| Brent Oil | 85.62 | ↑ Sell | |||
| Natural Gas | 1.946 | ↑ Sell | |||
| US Coffee C | 213.73 | ↑ Sell |
| Euro Stoxx 50 | 4,920.55 | ↑ Sell | |||
| S&P 500 | 5,035.69 | ↑ Sell | |||
| DAX | 17,921.95 | ↑ Sell | |||
| FTSE 100 | 8,144.13 | Sell | |||
| Hang Seng | 17,763.03 | ↑ Sell | |||
| Small Cap 2000 | 1,973.05 | ↑ Sell | |||
| IBEX 35 | 10,854.40 | Neutral |
| BASF | 49.155 | ↑ Sell | |||
| Bayer | 27.35 | ↑ Sell | |||
| Allianz | 266.60 | ↑ Sell | |||
| Adidas | 226.40 | ↑ Sell | |||
| Lufthansa | 6.714 | Neutral | |||
| Siemens AG | 175.90 | ↑ Sell | |||
| Deutsche Bank AG | 15.010 | Neutral |
| Mua/Bán 1 chỉ SJC # So hôm qua # Chênh TG | |
|---|---|
| SJC Eximbank | 8,300/ 8,500 (8,300/ 8,500) # 1,298 |
| SJC 1L, 10L, 1KG | 8,300/ 8,520 (0/ 0) # 1,510 |
| SJC 1c, 2c, 5c | 7,380/ 7,550 (0/ 0) # 540 |
| SJC 0,5c | 7,380/ 7,560 (0/ 0) # 550 |
| SJC 99,99% | 7,370/ 7,470 (0/ 0) # 460 |
| SJC 99% | 7,196/ 7,396 (0/ 0) # 386 |
| Cập nhật 01-05-2024 10:45:19 | |
| Xem lịch sử giá vàng SJC: nhấn đây! | |
| ↀ Giá vàng thế giới | ||
|---|---|---|
| $2,285.72 | -47.5 | -2.04% |

| ʘ Giá bán lẻ xăng dầu | ||
|---|---|---|
| Sản phẩm | Vùng 1 | Vùng 2 |
| RON 95-V | 25.440 | 25.940 |
| RON 95-III | 24.910 | 25.400 |
| E5 RON 92-II | 23.910 | 24.380 |
| DO 0.05S | 20.710 | 21.120 |
| DO 0,001S-V | 21.320 | 21.740 |
| Dầu hỏa 2-K | 20.680 | 21.090 |
| ↂ Giá dầu thô thế giới | |||
|---|---|---|---|
| WTI | $80.83 | +3.39 | 0.04% |
| Brent | $85.50 | +3.86 | 0.05% |
| $ Tỷ giá Vietcombank | ||
|---|---|---|
| Ngoại tệ | Mua vào | Bán ra |
| USD | 25.088,00 | 25.458,00 |
| EUR | 26.475,36 | 27.949,19 |
| GBP | 30.873,52 | 32.211,36 |
| JPY | 156,74 | 166,02 |
| KRW | 15,92 | 19,31 |
| Cập nhật lúc 10:45:15 01/05/2024 Xem bảng tỷ giá hối đoái | ||

