


(Bloomberg) -- A barrage of data Thursday offered a mixed view of the US economy in the face of rapid inflation, including more tempered retail activity and a labor market that’s still vibrant.
Retail sales indicated spending on goods, while far from collapsing, is moderating. And applications for unemployment insurance dropped for the fifth straight week, suggesting demand for workers remains healthy. Several manufacturing reports, including a modest gain in factory production, were also mixed.
The data illustrate the many economic cross currents the Federal Reserve is navigating as it attempts a soft landing for the economy while pressing harder on the monetary policy brakes to stamp out the fastest inflation in a generation.
Policy makers are all but sure to raise interest rates by another 75 basis points next week after a government data earlier this week showed consumer prices accelerated more than expected.
The retail sales report showed that while households are breathing a sigh of relief from lower prices at the gas pump, widespread inflation is limiting Americans’ ability to spend on discretionary items. Total sales rose 0.3%, though the figures aren’t adjusted for price changes.
So-called control group sales that exclude food services, gasoline, building materials and autos -- used to calculate gross domestic product -- were stagnant in August and the prior month’s gain was half as much as initially reported.
Still, the report suggests consumer spending is far from collapsing as eight of 13 retail categories increased. Moreover, the data showed a rebound in restaurant receipts that may suggest spending on services remains solid.
What Bloomberg Economics Says...
“To the extent that weak retail sales reflect moderating demand, that’s a plus from the Fed’s perspective as it tries to tame inflation. However, with consumers allocating more of their money to services, the tepid result may not accurately reflect the economy’s underlying momentum.”
--Eliza Winger, economist
To read the full note, click here
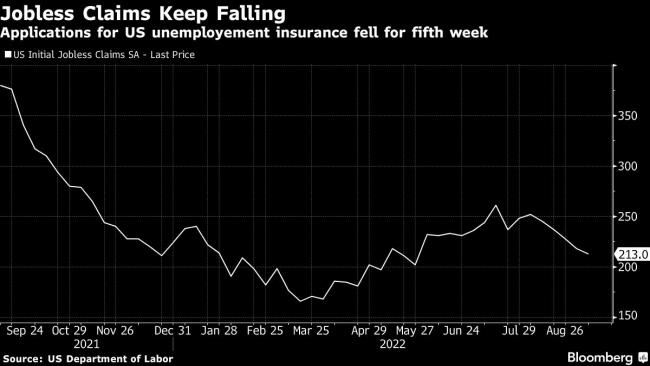
A healthy job market helps explain plenty of the resiliency in demand. Initial unemployment claims decreased by 5,000 to 213,000 in the week ended Sept. 10, according to the Labor Department. The four-week moving average, which smooths out volatility from week to week, dropped to the lowest level since June.
Jobless claims have been dropping as employers are still trying to fill millions of open positions and retain the workers they already have. The strength of labor demand is fueling firmer wage growth and feeding into inflationary pressures, helping explain why the Fed is trying to cool it.
Meantime, the Fed’s industrial production report showed factory production rose slightly in August as resilient business investment more than offset a pullback in the output of consumer goods.
While domestic demand is generally holding up, manufacturers face a number of headwinds including a shift in consumer behavior toward services and away from goods. That change in preferences caught some retailers flat-footed, leading to an inventory overhang and canceled orders that are further weighing on production.
Foreign demand is at risk of softening at well, as an energy crisis grips Europe, China’s economy cools and a surge in the value of dollar raises the costs of US goods for overseas customers.
A pair of regional Fed bank surveys on Thursday showed mixed results. A gauge of manufacturing in New York state snapped back in September on firmer orders and shipments after plunging in the prior month. At the same time, the Philadelphia Fed’s gauge contracted for the third time in four months.
“With global manufacturing slumping due to the double whammy of zero-Covid lockdowns in China and rocketing energy prices in Europe, we expect any further gains in US manufacturing output over the coming months to be similarly muted,” Paul Ashworth, chief North America economist at Capital Economics, said in a note.
©2022 Bloomberg L.P.


EUR/USD
1.0658
-0.0008 (-0.07%)
Summary
↑ SellMoving Avg:
Buy (0)
Sell (12)
Indicators:
Buy (2)
Sell (3)
EUR/USD
1.0658
-0.0008 (-0.07%)
Summary
↑ SellMoving Avg:
Buy (0)
Sell (12)
Indicators:
Buy (2)
Sell (3)
GBP/USD
1.2475
-0.0015 (-0.12%)
Summary
↑ SellMoving Avg:
Buy (0)
Sell (12)
Indicators:
Buy (0)
Sell (10)
USD/JPY
157.91
+0.12 (+0.07%)
Summary
↑ BuyMoving Avg:
Buy (12)
Sell (0)
Indicators:
Buy (9)
Sell (0)
AUD/USD
0.6469
-0.0003 (-0.05%)
Summary
NeutralMoving Avg:
Buy (10)
Sell (2)
Indicators:
Buy (2)
Sell (3)
USD/CAD
1.3780
+0.0003 (+0.03%)
Summary
↑ BuyMoving Avg:
Buy (12)
Sell (0)
Indicators:
Buy (7)
Sell (0)
EUR/JPY
168.32
+0.10 (+0.06%)
Summary
↑ BuyMoving Avg:
Buy (12)
Sell (0)
Indicators:
Buy (9)
Sell (0)
EUR/CHF
0.9808
+0.0001 (+0.01%)
Summary
NeutralMoving Avg:
Buy (0)
Sell (12)
Indicators:
Buy (3)
Sell (2)
Gold Futures
2,295.80
-7.10 (-0.31%)
Summary
↑ SellMoving Avg:
Buy (0)
Sell (12)
Indicators:
Buy (0)
Sell (9)
Silver Futures
26.677
+0.023 (+0.09%)
Summary
↑ SellMoving Avg:
Buy (2)
Sell (10)
Indicators:
Buy (0)
Sell (9)
Copper Futures
4.5305
-0.0105 (-0.23%)
Summary
↑ BuyMoving Avg:
Buy (10)
Sell (2)
Indicators:
Buy (8)
Sell (1)
Crude Oil WTI Futures
81.14
-0.79 (-0.96%)
Summary
↑ SellMoving Avg:
Buy (0)
Sell (12)
Indicators:
Buy (1)
Sell (7)
Brent Oil Futures
85.62
-0.71 (-0.82%)
Summary
↑ SellMoving Avg:
Buy (1)
Sell (11)
Indicators:
Buy (1)
Sell (7)
Natural Gas Futures
1.946
-0.009 (-0.46%)
Summary
↑ SellMoving Avg:
Buy (0)
Sell (12)
Indicators:
Buy (0)
Sell (5)
US Coffee C Futures
213.73
-13.77 (-6.05%)
Summary
↑ SellMoving Avg:
Buy (3)
Sell (9)
Indicators:
Buy (0)
Sell (10)
Euro Stoxx 50
4,920.55
-60.54 (-1.22%)
Summary
↑ SellMoving Avg:
Buy (4)
Sell (8)
Indicators:
Buy (1)
Sell (7)
S&P 500
5,035.69
-80.48 (-1.57%)
Summary
↑ SellMoving Avg:
Buy (0)
Sell (12)
Indicators:
Buy (0)
Sell (7)
DAX
17,921.95
-196.37 (-1.08%)
Summary
↑ SellMoving Avg:
Buy (0)
Sell (12)
Indicators:
Buy (1)
Sell (6)
FTSE 100
8,144.13
-2.90 (-0.04%)
Summary
SellMoving Avg:
Buy (5)
Sell (7)
Indicators:
Buy (2)
Sell (4)
Hang Seng
17,763.03
+16.12 (+0.09%)
Summary
↑ SellMoving Avg:
Buy (0)
Sell (12)
Indicators:
Buy (1)
Sell (6)
US Small Cap 2000
1,973.05
-42.98 (-2.13%)
Summary
↑ SellMoving Avg:
Buy (0)
Sell (12)
Indicators:
Buy (0)
Sell (7)
IBEX 35
10,854.40
-246.40 (-2.22%)
Summary
NeutralMoving Avg:
Buy (6)
Sell (6)
Indicators:
Buy (3)
Sell (3)
BASF SE NA O.N.
49.155
+0.100 (+0.20%)
Summary
↑ SellMoving Avg:
Buy (0)
Sell (12)
Indicators:
Buy (1)
Sell (7)
Bayer AG NA
27.35
-0.24 (-0.87%)
Summary
↑ SellMoving Avg:
Buy (0)
Sell (12)
Indicators:
Buy (0)
Sell (8)
Allianz SE VNA O.N.
266.60
+0.30 (+0.11%)
Summary
↑ SellMoving Avg:
Buy (0)
Sell (12)
Indicators:
Buy (3)
Sell (5)
Adidas AG
226.40
-5.90 (-2.54%)
Summary
↑ SellMoving Avg:
Buy (0)
Sell (12)
Indicators:
Buy (2)
Sell (7)
Deutsche Lufthansa AG
6.714
-0.028 (-0.42%)
Summary
NeutralMoving Avg:
Buy (3)
Sell (9)
Indicators:
Buy (9)
Sell (1)
Siemens AG Class N
175.90
-1.74 (-0.98%)
Summary
↑ SellMoving Avg:
Buy (0)
Sell (12)
Indicators:
Buy (0)
Sell (9)
Deutsche Bank AG
15.010
-0.094 (-0.62%)
Summary
NeutralMoving Avg:
Buy (4)
Sell (8)
Indicators:
Buy (6)
Sell (2)
| EUR/USD | 1.0658 | ↑ Sell | |||
| GBP/USD | 1.2475 | ↑ Sell | |||
| USD/JPY | 157.91 | ↑ Buy | |||
| AUD/USD | 0.6469 | Neutral | |||
| USD/CAD | 1.3780 | ↑ Buy | |||
| EUR/JPY | 168.32 | ↑ Buy | |||
| EUR/CHF | 0.9808 | Neutral |
| Gold | 2,295.80 | ↑ Sell | |||
| Silver | 26.677 | ↑ Sell | |||
| Copper | 4.5305 | ↑ Buy | |||
| Crude Oil WTI | 81.14 | ↑ Sell | |||
| Brent Oil | 85.62 | ↑ Sell | |||
| Natural Gas | 1.946 | ↑ Sell | |||
| US Coffee C | 213.73 | ↑ Sell |
| Euro Stoxx 50 | 4,920.55 | ↑ Sell | |||
| S&P 500 | 5,035.69 | ↑ Sell | |||
| DAX | 17,921.95 | ↑ Sell | |||
| FTSE 100 | 8,144.13 | Sell | |||
| Hang Seng | 17,763.03 | ↑ Sell | |||
| Small Cap 2000 | 1,973.05 | ↑ Sell | |||
| IBEX 35 | 10,854.40 | Neutral |
| BASF | 49.155 | ↑ Sell | |||
| Bayer | 27.35 | ↑ Sell | |||
| Allianz | 266.60 | ↑ Sell | |||
| Adidas | 226.40 | ↑ Sell | |||
| Lufthansa | 6.714 | Neutral | |||
| Siemens AG | 175.90 | ↑ Sell | |||
| Deutsche Bank AG | 15.010 | Neutral |
| Mua/Bán 1 chỉ SJC # So hôm qua # Chênh TG | |
|---|---|
| SJC Eximbank | 8,300/ 8,500 (8,300/ 8,500) # 1,298 |
| SJC 1L, 10L, 1KG | 8,300/ 8,520 (0/ 0) # 1,510 |
| SJC 1c, 2c, 5c | 7,380/ 7,550 (0/ 0) # 540 |
| SJC 0,5c | 7,380/ 7,560 (0/ 0) # 550 |
| SJC 99,99% | 7,370/ 7,470 (0/ 0) # 460 |
| SJC 99% | 7,196/ 7,396 (0/ 0) # 386 |
| Cập nhật 01-05-2024 10:45:19 | |
| Xem lịch sử giá vàng SJC: nhấn đây! | |
| ↀ Giá vàng thế giới | ||
|---|---|---|
| $2,285.72 | -47.5 | -2.04% |

| ʘ Giá bán lẻ xăng dầu | ||
|---|---|---|
| Sản phẩm | Vùng 1 | Vùng 2 |
| RON 95-V | 25.440 | 25.940 |
| RON 95-III | 24.910 | 25.400 |
| E5 RON 92-II | 23.910 | 24.380 |
| DO 0.05S | 20.710 | 21.120 |
| DO 0,001S-V | 21.320 | 21.740 |
| Dầu hỏa 2-K | 20.680 | 21.090 |
| ↂ Giá dầu thô thế giới | |||
|---|---|---|---|
| WTI | $80.83 | +3.39 | 0.04% |
| Brent | $85.50 | +3.86 | 0.05% |
| $ Tỷ giá Vietcombank | ||
|---|---|---|
| Ngoại tệ | Mua vào | Bán ra |
| USD | 25.088,00 | 25.458,00 |
| EUR | 26.475,36 | 27.949,19 |
| GBP | 30.873,52 | 32.211,36 |
| JPY | 156,74 | 166,02 |
| KRW | 15,92 | 19,31 |
| Cập nhật lúc 10:45:15 01/05/2024 Xem bảng tỷ giá hối đoái | ||

