


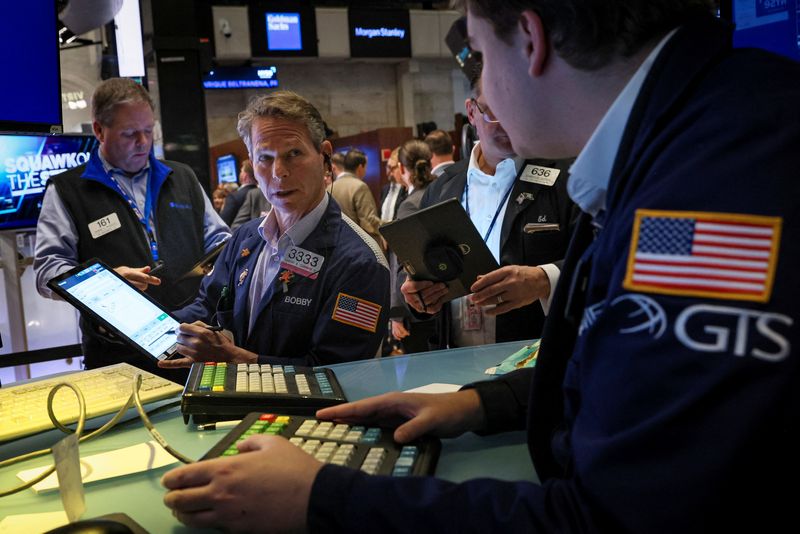
 © Reuters. Traders work on the floor of the New York Stock Exchange (NYSE) in New York City, U.S., December 7, 2022. REUTERS/Brendan McDermid
By Stephen Culp
NEW YORK (Reuters) - Wall Street was mostly lower at the beginning of a holiday- shortened week on Tuesday as investors weighed the likelihood of protracted restrictive Fed policy against China's relaxation of its strict zero-COVID rules.
Interest rate sensitive growth stocks weighed heaviest, dragging the tech-laden Nasdaq down the most. The S&P 500 joined the Nasdaq in negative territory, while the Dow, buoyed by value stocks, was modestly green.
"On down days value tends to do well relative to growth," said Tim Ghriskey, senior portfolio strategist at Ingalls & Snyder in New York.
"There's not a lot of news out there, thin volume, the China issue is out there, the normalization of a post-COVID environment," Ghriskey added.
Shares of Tesla (NASDAQ:TSLA) Inc tumbled 8.3% after a review by Reuters of an internal schedule revealed the electric vehicle maker plans to scale back production at its Shanghai plant.
With Tuesday's move, Tesla stock has lost nearly 68% of its value this year.
Rising Treasury yields put interest rate sensitive growth stocks under pressure, a recurring theme in 2022. For the year, growth shares have plunged over 30% compared with value's slide of about 7.5% over the same period.
With just four trading days remaining in 2022, all three indexes are on course to post their biggest annual loss since 2008, the nadir of the global financial crisis.
"(This year) was all about the Fed raising rates, perhaps belatedly," Ghriskey said. The aggressiveness to bring inflation down to the 2% level has shocked the market and investors.
Beijing eased its strict COVID-19 curbs, which have battered the $17 trillion economy, fueling hopes of a revival in global demand and an improving supply chain.
On the economic front, the Commerce Department's initial take on the U.S. goods trade balance showed the deficit narrowing by 15.6%, while S&P Case-Shiller showed home price growth in its 20-city composite cooled to 8.6% year-on-year, the lowest reading since November 2020.
The Dow Jones Industrial Average rose 68.31 points, or 0.21%, to 33,272.24, the S&P 500 lost 13.95 points, or 0.36%, to 3,830.87 and the Nasdaq Composite dropped 128.05 points, or 1.22%, to 10,369.81.
Of the 11 major sectors in the S&P 500, consumer discretionary and communication services suffered the steepest percentage loss.
Energy stocks were up the most, advancing 1.2% as crude prices rose on an expected demand boost from China's relaxed COVID restrictions.
U.S.-listed shares of Chinese firms including JD (NASDAQ:JD).Com Inc, Alibaba (NYSE:BABA) Group Holding Ltd and Pinduoduo (NASDAQ:PDD) Inc gained between 2% and 4.2% after Beijing announced it was relaxing travel restrictions.
Southwest Airlines (NYSE:LUV) Co fell 5.5% after harsh weather forced the discount commercial carrier to lead its peers in cancellations. The broader S&P 1500 Airlines index was off 2.4%.
Declining issues outnumbered advancing ones on the NYSE by a 1.32-to-1 ratio; on Nasdaq, a 1.86-to-1 ratio favored decliners.
The S&P 500 posted 7 new 52-week highs and 3 new lows; the Nasdaq Composite recorded 74 new highs and 377 new lows.


EUR/USD
1.0658
-0.0008 (-0.07%)
Summary
↑ SellMoving Avg:
Buy (0)
Sell (12)
Indicators:
Buy (2)
Sell (3)
EUR/USD
1.0658
-0.0008 (-0.07%)
Summary
↑ SellMoving Avg:
Buy (0)
Sell (12)
Indicators:
Buy (2)
Sell (3)
GBP/USD
1.2475
-0.0015 (-0.12%)
Summary
↑ SellMoving Avg:
Buy (0)
Sell (12)
Indicators:
Buy (0)
Sell (10)
USD/JPY
157.91
+0.12 (+0.07%)
Summary
↑ BuyMoving Avg:
Buy (12)
Sell (0)
Indicators:
Buy (9)
Sell (0)
AUD/USD
0.6469
-0.0003 (-0.05%)
Summary
NeutralMoving Avg:
Buy (10)
Sell (2)
Indicators:
Buy (2)
Sell (3)
USD/CAD
1.3780
+0.0003 (+0.03%)
Summary
↑ BuyMoving Avg:
Buy (12)
Sell (0)
Indicators:
Buy (7)
Sell (0)
EUR/JPY
168.32
+0.10 (+0.06%)
Summary
↑ BuyMoving Avg:
Buy (12)
Sell (0)
Indicators:
Buy (9)
Sell (0)
EUR/CHF
0.9808
+0.0001 (+0.01%)
Summary
NeutralMoving Avg:
Buy (0)
Sell (12)
Indicators:
Buy (3)
Sell (2)
Gold Futures
2,295.80
-7.10 (-0.31%)
Summary
↑ SellMoving Avg:
Buy (0)
Sell (12)
Indicators:
Buy (0)
Sell (9)
Silver Futures
26.677
+0.023 (+0.09%)
Summary
↑ SellMoving Avg:
Buy (2)
Sell (10)
Indicators:
Buy (0)
Sell (9)
Copper Futures
4.5305
-0.0105 (-0.23%)
Summary
↑ BuyMoving Avg:
Buy (10)
Sell (2)
Indicators:
Buy (8)
Sell (1)
Crude Oil WTI Futures
81.14
-0.79 (-0.96%)
Summary
↑ SellMoving Avg:
Buy (0)
Sell (12)
Indicators:
Buy (1)
Sell (7)
Brent Oil Futures
85.62
-0.71 (-0.82%)
Summary
↑ SellMoving Avg:
Buy (1)
Sell (11)
Indicators:
Buy (1)
Sell (7)
Natural Gas Futures
1.946
-0.009 (-0.46%)
Summary
↑ SellMoving Avg:
Buy (0)
Sell (12)
Indicators:
Buy (0)
Sell (5)
US Coffee C Futures
213.73
-13.77 (-6.05%)
Summary
↑ SellMoving Avg:
Buy (3)
Sell (9)
Indicators:
Buy (0)
Sell (10)
Euro Stoxx 50
4,920.55
-60.54 (-1.22%)
Summary
↑ SellMoving Avg:
Buy (4)
Sell (8)
Indicators:
Buy (1)
Sell (7)
S&P 500
5,035.69
-80.48 (-1.57%)
Summary
↑ SellMoving Avg:
Buy (0)
Sell (12)
Indicators:
Buy (0)
Sell (7)
DAX
17,921.95
-196.37 (-1.08%)
Summary
↑ SellMoving Avg:
Buy (0)
Sell (12)
Indicators:
Buy (1)
Sell (6)
FTSE 100
8,144.13
-2.90 (-0.04%)
Summary
SellMoving Avg:
Buy (5)
Sell (7)
Indicators:
Buy (2)
Sell (4)
Hang Seng
17,763.03
+16.12 (+0.09%)
Summary
↑ SellMoving Avg:
Buy (0)
Sell (12)
Indicators:
Buy (1)
Sell (6)
US Small Cap 2000
1,973.05
-42.98 (-2.13%)
Summary
↑ SellMoving Avg:
Buy (0)
Sell (12)
Indicators:
Buy (0)
Sell (7)
IBEX 35
10,854.40
-246.40 (-2.22%)
Summary
NeutralMoving Avg:
Buy (6)
Sell (6)
Indicators:
Buy (3)
Sell (3)
BASF SE NA O.N.
49.155
+0.100 (+0.20%)
Summary
↑ SellMoving Avg:
Buy (0)
Sell (12)
Indicators:
Buy (1)
Sell (7)
Bayer AG NA
27.35
-0.24 (-0.87%)
Summary
↑ SellMoving Avg:
Buy (0)
Sell (12)
Indicators:
Buy (0)
Sell (8)
Allianz SE VNA O.N.
266.60
+0.30 (+0.11%)
Summary
↑ SellMoving Avg:
Buy (0)
Sell (12)
Indicators:
Buy (3)
Sell (5)
Adidas AG
226.40
-5.90 (-2.54%)
Summary
↑ SellMoving Avg:
Buy (0)
Sell (12)
Indicators:
Buy (2)
Sell (7)
Deutsche Lufthansa AG
6.714
-0.028 (-0.42%)
Summary
NeutralMoving Avg:
Buy (3)
Sell (9)
Indicators:
Buy (9)
Sell (1)
Siemens AG Class N
175.90
-1.74 (-0.98%)
Summary
↑ SellMoving Avg:
Buy (0)
Sell (12)
Indicators:
Buy (0)
Sell (9)
Deutsche Bank AG
15.010
-0.094 (-0.62%)
Summary
NeutralMoving Avg:
Buy (4)
Sell (8)
Indicators:
Buy (6)
Sell (2)
| EUR/USD | 1.0658 | ↑ Sell | |||
| GBP/USD | 1.2475 | ↑ Sell | |||
| USD/JPY | 157.91 | ↑ Buy | |||
| AUD/USD | 0.6469 | Neutral | |||
| USD/CAD | 1.3780 | ↑ Buy | |||
| EUR/JPY | 168.32 | ↑ Buy | |||
| EUR/CHF | 0.9808 | Neutral |
| Gold | 2,295.80 | ↑ Sell | |||
| Silver | 26.677 | ↑ Sell | |||
| Copper | 4.5305 | ↑ Buy | |||
| Crude Oil WTI | 81.14 | ↑ Sell | |||
| Brent Oil | 85.62 | ↑ Sell | |||
| Natural Gas | 1.946 | ↑ Sell | |||
| US Coffee C | 213.73 | ↑ Sell |
| Euro Stoxx 50 | 4,920.55 | ↑ Sell | |||
| S&P 500 | 5,035.69 | ↑ Sell | |||
| DAX | 17,921.95 | ↑ Sell | |||
| FTSE 100 | 8,144.13 | Sell | |||
| Hang Seng | 17,763.03 | ↑ Sell | |||
| Small Cap 2000 | 1,973.05 | ↑ Sell | |||
| IBEX 35 | 10,854.40 | Neutral |
| BASF | 49.155 | ↑ Sell | |||
| Bayer | 27.35 | ↑ Sell | |||
| Allianz | 266.60 | ↑ Sell | |||
| Adidas | 226.40 | ↑ Sell | |||
| Lufthansa | 6.714 | Neutral | |||
| Siemens AG | 175.90 | ↑ Sell | |||
| Deutsche Bank AG | 15.010 | Neutral |
| Mua/Bán 1 chỉ SJC # So hôm qua # Chênh TG | |
|---|---|
| SJC Eximbank | 8,300/ 8,500 (8,300/ 8,500) # 1,298 |
| SJC 1L, 10L, 1KG | 8,300/ 8,520 (0/ 0) # 1,510 |
| SJC 1c, 2c, 5c | 7,380/ 7,550 (0/ 0) # 540 |
| SJC 0,5c | 7,380/ 7,560 (0/ 0) # 550 |
| SJC 99,99% | 7,370/ 7,470 (0/ 0) # 460 |
| SJC 99% | 7,196/ 7,396 (0/ 0) # 386 |
| Cập nhật 01-05-2024 10:45:19 | |
| Xem lịch sử giá vàng SJC: nhấn đây! | |
| ↀ Giá vàng thế giới | ||
|---|---|---|
| $2,285.72 | -47.5 | -2.04% |

| ʘ Giá bán lẻ xăng dầu | ||
|---|---|---|
| Sản phẩm | Vùng 1 | Vùng 2 |
| RON 95-V | 25.440 | 25.940 |
| RON 95-III | 24.910 | 25.400 |
| E5 RON 92-II | 23.910 | 24.380 |
| DO 0.05S | 20.710 | 21.120 |
| DO 0,001S-V | 21.320 | 21.740 |
| Dầu hỏa 2-K | 20.680 | 21.090 |
| ↂ Giá dầu thô thế giới | |||
|---|---|---|---|
| WTI | $80.83 | +3.39 | 0.04% |
| Brent | $85.50 | +3.86 | 0.05% |
| $ Tỷ giá Vietcombank | ||
|---|---|---|
| Ngoại tệ | Mua vào | Bán ra |
| USD | 25.088,00 | 25.458,00 |
| EUR | 26.475,36 | 27.949,19 |
| GBP | 30.873,52 | 32.211,36 |
| JPY | 156,74 | 166,02 |
| KRW | 15,92 | 19,31 |
| Cập nhật lúc 10:45:15 01/05/2024 Xem bảng tỷ giá hối đoái | ||

